MIT's η-Learning Generates Extreme-Event Scenarios Without Ever Seeing One
MIT's Extreme Event Aware (η-learning) algorithm generates plausible maps of unprecedented storms, floods, and wildfires without training on historical disasters — published Aug 20 in Nature Communications.
Can a city’s seawall survive a blockbuster storm? Will a regional power grid hold through record-breaking heat? Can a town’s fire services contain a major wildfire? Answering any of these questions requires knowing how such events could actually unfold — how far the wildfire spreads, how much territory a storm covers, how many days a heat wave persists. But extreme events are, by definition, outliers: rare, sporadic, and poorly represented in the historical record. Most risk-assessment methods therefore face a fundamental catch-22 — to anticipate unprecedented disasters, they must first be trained on disasters that already happened.
A team of MIT engineers has now broken that circularity. In an open-access paper published August 20 in Nature Communications, graduate student Kai Chang and Professor Themis Sapsis describe a machine-learning method that generates realistic maps of extreme events and worst-case scenarios without ever training on an extreme event. MIT News publicized the work on August 24, and it has been circulating widely across the AI and climate communities since.
The problem with learning from disaster
When planners, policymakers, and insurers ask “what does a once-every-100-year storm look like for New York City?”, conventional simulation tools look backward: they mine historical data for the rare, catastrophic events it contains, learn the conditions that produced them, and extrapolate from there. The trouble is twofold. First, the most extreme events are scarce by nature — a 25-year weather record might contain only a handful of genuinely unprecedented ones. Second, and more fundamentally, the worst-case future event is by definition worse than anything in the training set.
“These methods assume there are very disastrous events that we have seen in the dataset, and they build a method to either estimate the risk of those events, or they try to predict exactly the events that have happened,” Chang explained. “We are trying to see: what do unprecedented extreme events look like that are riskier than everything that has happened before and yet are still plausible?”
If the most extreme rainfall ever recorded in New York City is 200 millimeters, the question that matters for infrastructure planning is what kind of storm could deliver 300 millimeters — an event that has never been recorded, yet remains physically possible. City engineers need to know where such a storm would make landfall, how large an area it would drench, and how intense the rainfall would be at its core.
How η-learning works
The team’s method, dubbed Extreme Event Aware learning — or η-learning (η being the Greek letter eta) — takes a statistical approach that sidesteps the need for historical extremes entirely. Instead, it learns the relationship between two complementary kinds of ordinary data:
- Point statistics — probabilities describing how often a measurable quantity, such as maximum rainfall across a region, reaches a given level. These statistics capture the tail behavior of a distribution even when the training window contains few or no extreme samples.
- Paired spatial maps — corresponding low- and high-resolution maps (for example, coarse and fine-grained precipitation maps) that teach the algorithm how broad, coarse patterns relate to detailed, localized structure.
By fusing the two, the algorithm learns to generate high-resolution spatial patterns that are consistent with the statistics of extremes — even when the specific extreme examples were never shown to it. The point statistics act as a constraint, filtering out implausible scenarios while allowing the generator to explore beyond the historical record.
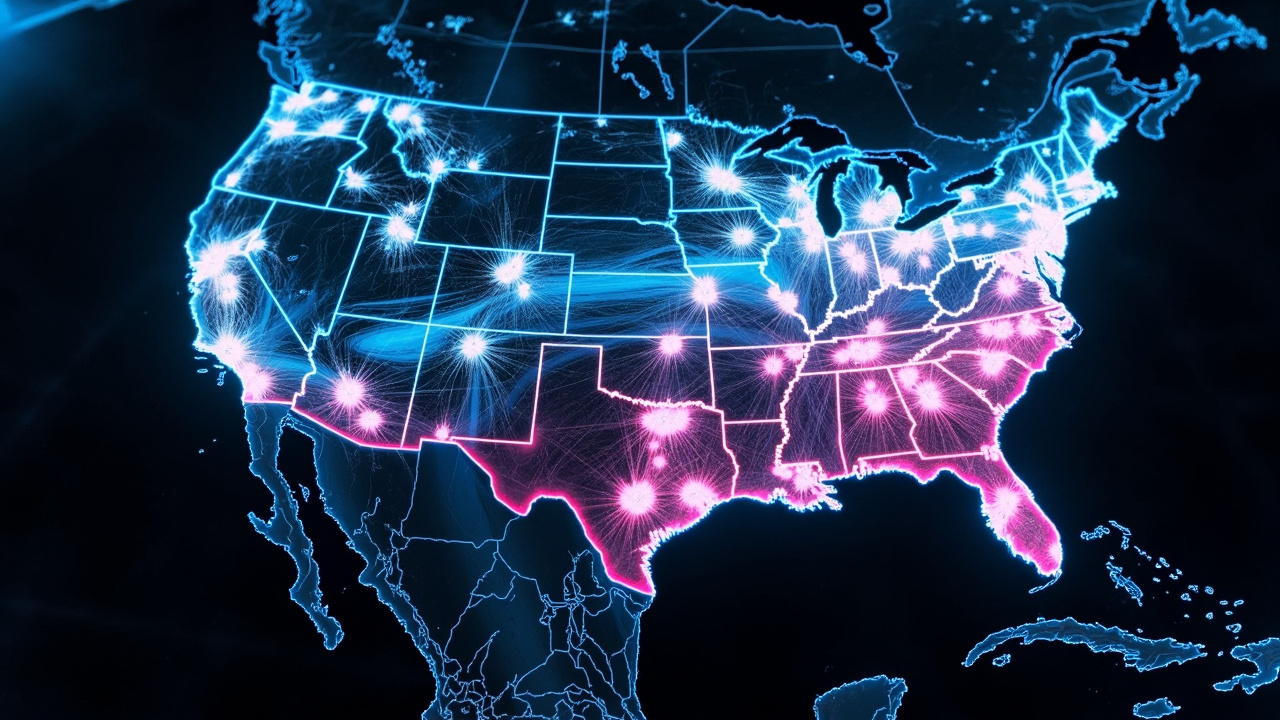
To validate the approach, the researchers applied it to extreme precipitation over the continental United States. They started from 25 years of hourly precipitation maps, pooled into daily maps, and computed point statistics describing how often daily maximum rainfall reached each intensity level. Critically, they then trained the algorithm on paired low- and high-resolution maps from just the first six months of the record — a window containing few or no examples of the most extreme rainfall levels.
Despite that impoverished training set, η-learning successfully generated statistically plausible spatial patterns for events more extreme than anything in its training data: the possible locations, sizes, and intensities of, say, a once-in-a-century rainfall event peaking at 300 millimeters. A user can simply prompt the trained model with a question like “what could a once-in-a-century storm look like in New York City?” and receive thousands of statistically consistent realizations — each a full map showing the storm’s footprint, coverage area, and intensity gradient.
Why it matters beyond weather
“Someone can say, ‘I’m interested in building things to withstand the risk of an event that happens every 100 years,’” Chang said. “What we can do then is produce thousands of possible realizations that will happen with this sort of rare frequency.”
The method is not limited to precipitation. As long as relevant point statistics and spatial data are available, the same framework can visualize unprecedented floods, wildfires, and other natural hazards. And the underlying mathematics applies to any system whose rare, high-impact states emerge from complex interactions — the team explicitly points to robotic navigation and financial markets as candidate domains.
“Financial market crashes are extreme events that are a complicated combination of things, involving many different sectors,” Chang noted. “What is the interaction that leads to a market crash? That is something that this method could explore.”
Sapsis framed the stakes in explicitly strategic terms: “Extreme events have become a strategic concern, not just an environmental one — we’ve optimized global systems for efficiency, and the price of that efficiency is that there’s very little slack left anywhere. A single extreme event propagates through supply chains, energy markets, and food systems in weeks. Being able to put a probability on an event that hasn’t happened yet is now a question of national and economic resilience.”
Context: AI weather modeling’s quiet revolution
η-learning lands amid a broader shift in how AI interacts with Earth-system science. GraphCast-style neural forecasters have already matched or beaten physical numerical models on medium-range weather prediction at a fraction of the compute cost, and AI-driven platforms increasingly fuse forecasts, river levels, and historical records for flood and wildfire early warning. But nearly all of these systems remain fundamentally interpolative — they excel at predicting futures that resemble the past.
The MIT work targets the complementary blind spot: the tail of the distribution. By anchoring generation in extreme-value statistics rather than extreme-event examples, it offers a way to stress-test infrastructure against storms that no one has yet experienced. For seawall designers, grid operators, insurers pricing century-scale tail risk, and supply-chain planners worried about correlated failures, that is precisely the question conventional tools answer worst.
The research was supported in part by a Vannevar Bush Faculty Fellowship and the U.S. Air Force Office of Scientific Research. The paper, “Extreme Event Aware (η-) Learning,” is open access, with a preprint available on arXiv — a detail that matters for a result aimed squarely at public-resilience applications.
The road ahead
As extreme weather intensifies globally and infrastructure decisions with 50-to-100-year horizons pile up, methods that can credibly enumerate the unprecedented will only grow in value. η-learning won’t replace physical simulation or operational forecasting, but it fills a genuine gap: a fast, data-driven way to generate thousands of plausible worst-case maps on demand. The next test will be adoption — whether engineering firms, reinsurers, and government agencies fold scenario generators like this into the planning workflows that decide how high the seawall gets built.